All projects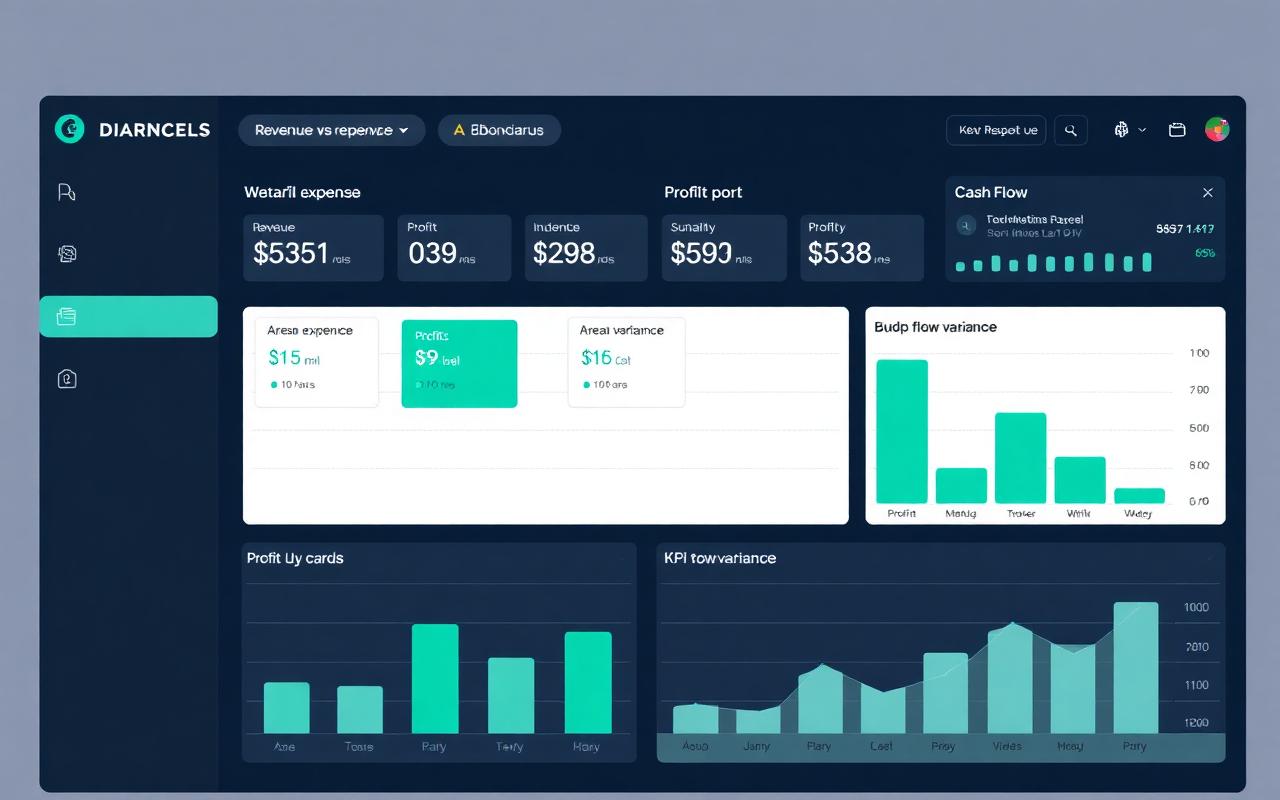
Excel
Power BI
Financial Dashboard
A finance reporting dashboard consolidating revenue, cost and cash movement into a single monitored view.
What the project covers
- Revenue
- Expenses
- Profit
- Cash flow
- Financial trends
- Budget performance
Key insights
- Expense growth tracked against revenue growth month over month.
- Budget versus actual variance surfaced per cost line.
- Cash flow view separates timing issues from profitability issues.
How it was built
The raw dataset was cleaned and validated first — types corrected, duplicates removed and missing values handled — before any measure was calculated. KPIs were then defined against the questions a decision-maker would ask, and the layout was arranged so the headline numbers read first, with supporting breakdowns and filters underneath.