Skip to content
Babafemi PaulData Analyst

Available for data analyst roles

Turning Data Into Insights That Drive Better Decisions.

Data Analyst specializing in Excel, SQL, Power BI, Tableau, data visualization, and statistical analysis.

Dashboard projects
6
Research project
1
Core tools
4
Babafemi Paul, Data Analyst

Excel · SQL · Power BI

Dashboards & analysis

What I do

Analysis built around the decision, not the tool

Every project starts with the question a stakeholder needs answered, then works backwards to the data, the cleaning and the visual that makes the answer obvious.

Data preparation

Cleaning, structuring and validating messy spreadsheets and exports before analysis begins.

Dashboards & BI

Excel and Power BI dashboards with defined KPIs, filters and clear visual hierarchy.

Statistical analysis

Descriptive statistics, hypothesis testing and regression applied to real questions.

Process

From Raw Data to Actionable Insights

A repeatable path from unstructured records to a recommendation a business can act on.

  1. 01

    Raw Data

    Spreadsheets, exports, survey responses and operational records.

  2. 02

    Data Cleaning

    De-duplicating, fixing types, handling missing values.

  3. 03

    Analysis

    Segmenting, aggregating and testing relationships.

  4. 04

    Visualization

    Charts and dashboards built around the key question.

  5. 05

    Insights

    The few findings that actually change something.

  6. 06

    Decision

    A clear recommendation the business can act on.

Skills

A toolkit spanning analysis, BI and research

Grouped by how the work actually happens — prepare the data, visualize it, then test what it means.

Data Analysis

Preparing and interrogating datasets until they answer the business question.

  • Microsoft Excel
  • SQL
  • Statistical Analysis
  • Data Cleaning
  • Exploratory Data Analysis

Visualization & BI

Building dashboards decision-makers can read in seconds.

  • Power BI
  • Tableau
  • Excel Dashboards
  • KPI Development
  • Data Storytelling

Research

Academic research methods applied to real business questions.

  • Survey Data Analysis
  • Regression Analysis
  • Descriptive Statistics
  • Hypothesis Testing
  • Research Reporting

Featured projects

Dashboards and research, end to end

A selection of the analytics work in my portfolio. Each project covers cleaning, KPI design, visualization and the insight that came out of it.

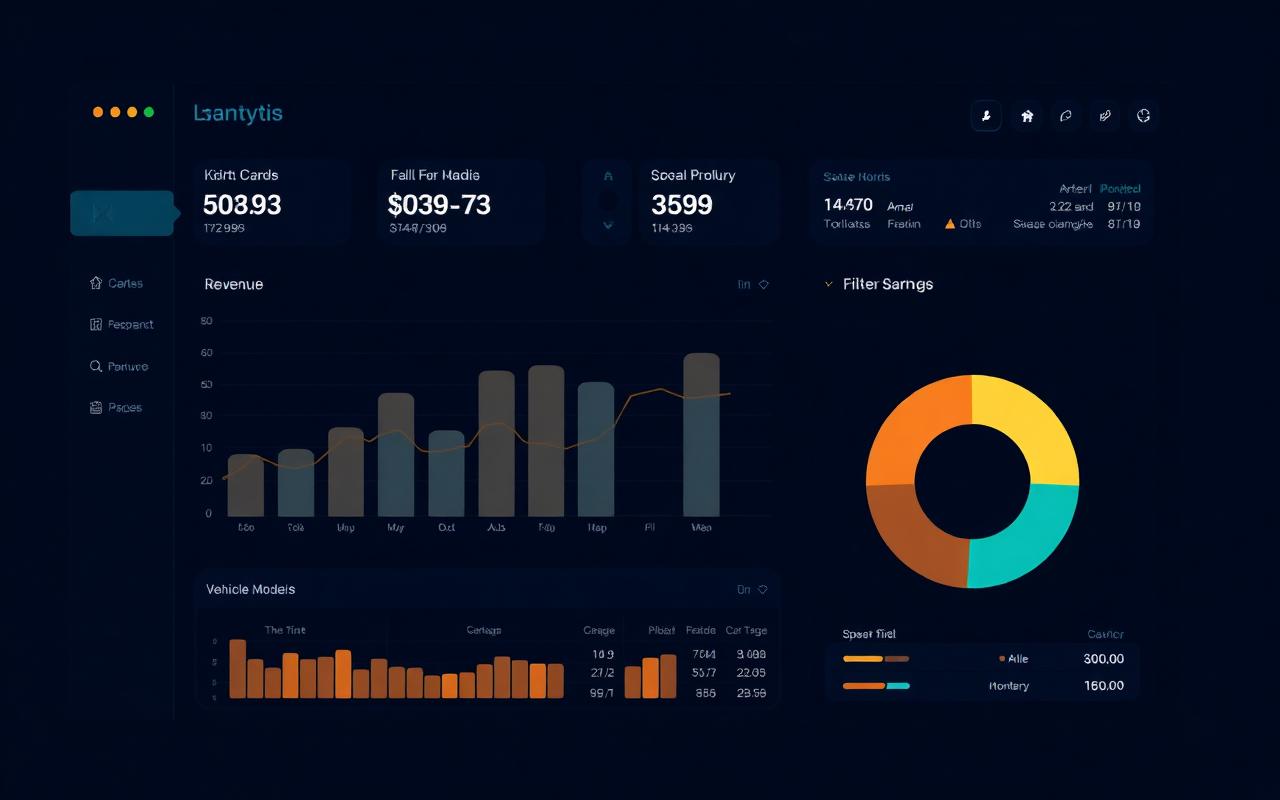
Car Sales Dashboard dashboard preview

Car Sales Dashboard

An interactive sales dashboard designed to analyze vehicle sales performance, revenue trends, customer behavior, and key sales KPIs.

Excel
Power BI
  • Revenue concentration across a small set of vehicle models.
  • Seasonality visible in monthly sales trends.
View Project
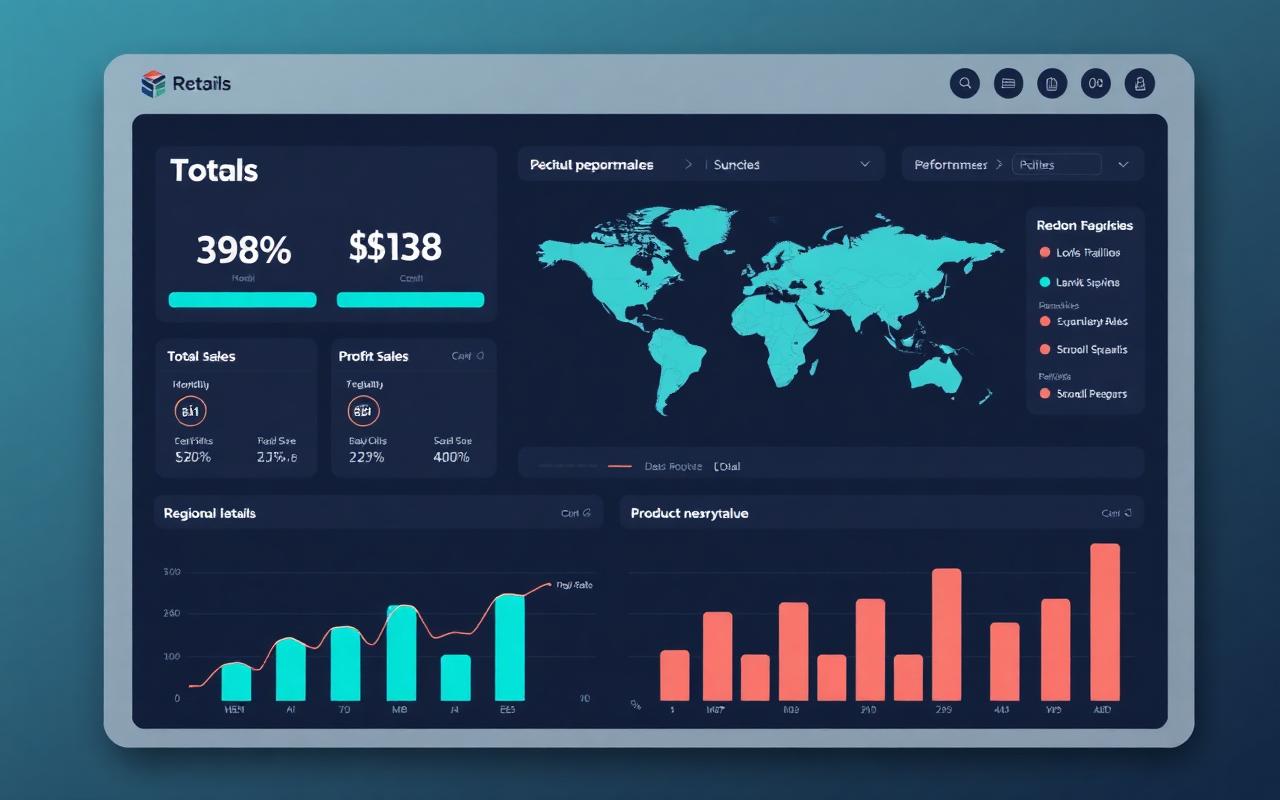
Retail Sales Dashboard dashboard preview

Retail Sales Dashboard

A retail performance dashboard tracking sales, profit and product movement across regions and customer segments.

Excel
Power BI
  • Profit and revenue rankings do not always agree by product.
  • Regional comparison highlights under-performing territories.
View Project
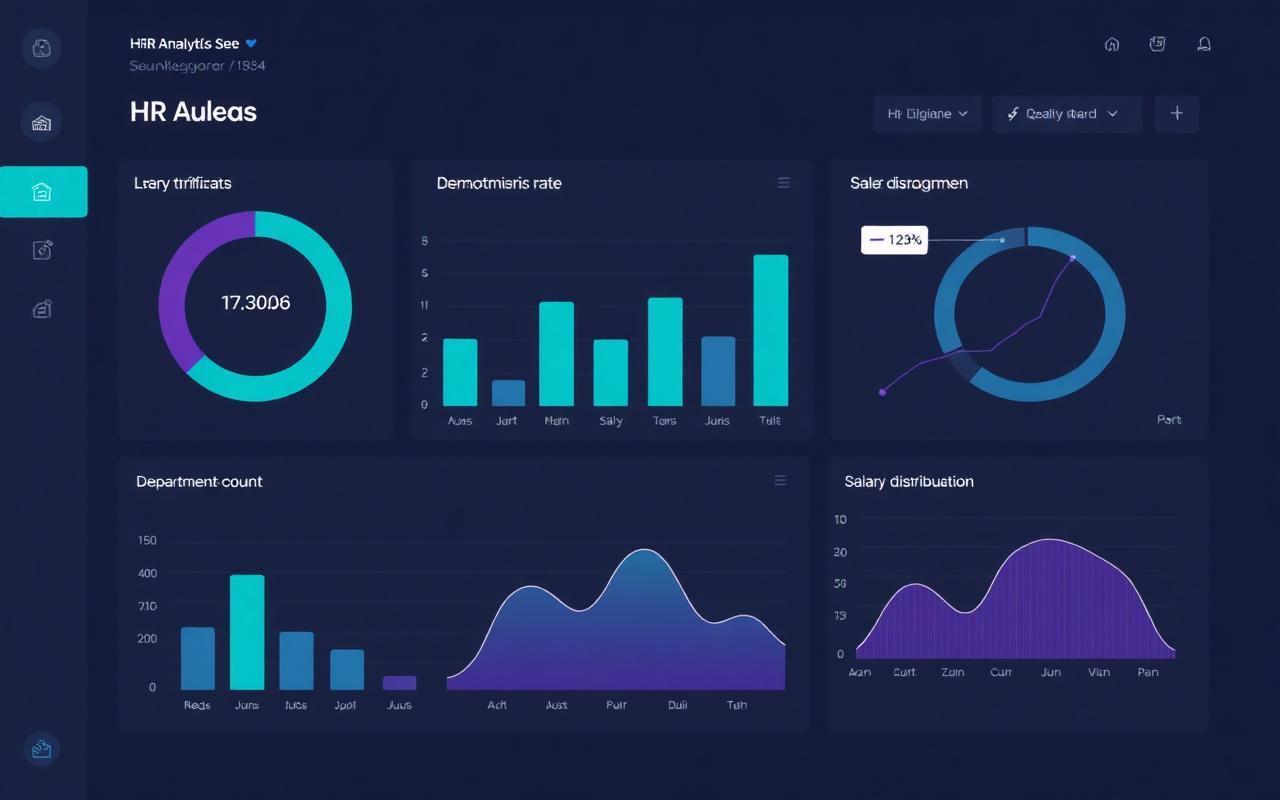
HR Analytics Dashboard dashboard preview

HR Analytics Dashboard

A people analytics dashboard exploring workforce composition, attrition and pay patterns across departments and job roles.

Excel
Power BI
  • Attrition clusters in specific departments and job roles.
  • Salary spread compared across roles and experience bands.
View Project

Need someone to make sense of your data?

I'm open to data analyst roles, freelance analysis and dashboard projects.

Get in touch