All projects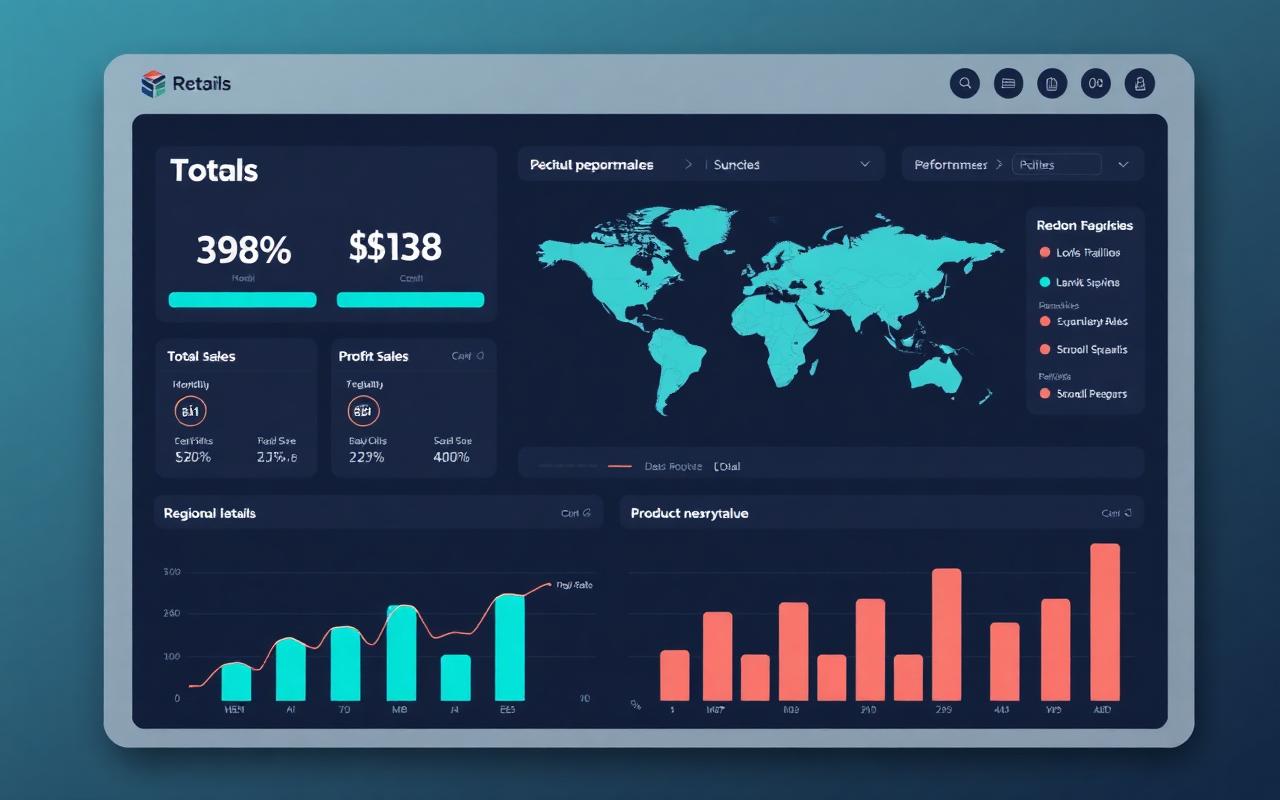
Excel
Power BI
Retail Sales Dashboard
A retail performance dashboard tracking sales, profit and product movement across regions and customer segments.
What the project covers
- Total sales
- Profit
- Product performance
- Regional performance
- Monthly trends
- Customer segments
Key insights
- Profit and revenue rankings do not always agree by product.
- Regional comparison highlights under-performing territories.
- Segment view separates high-volume from high-margin customers.
How it was built
The raw dataset was cleaned and validated first — types corrected, duplicates removed and missing values handled — before any measure was calculated. KPIs were then defined against the questions a decision-maker would ask, and the layout was arranged so the headline numbers read first, with supporting breakdowns and filters underneath.