Skip to content
Babafemi PaulData Analyst

Portfolio

Featured projects

Dashboards and analysis built end to end — data cleaning, KPI definition, visualization and the insights that came out. Filter by the tool or discipline you care about.

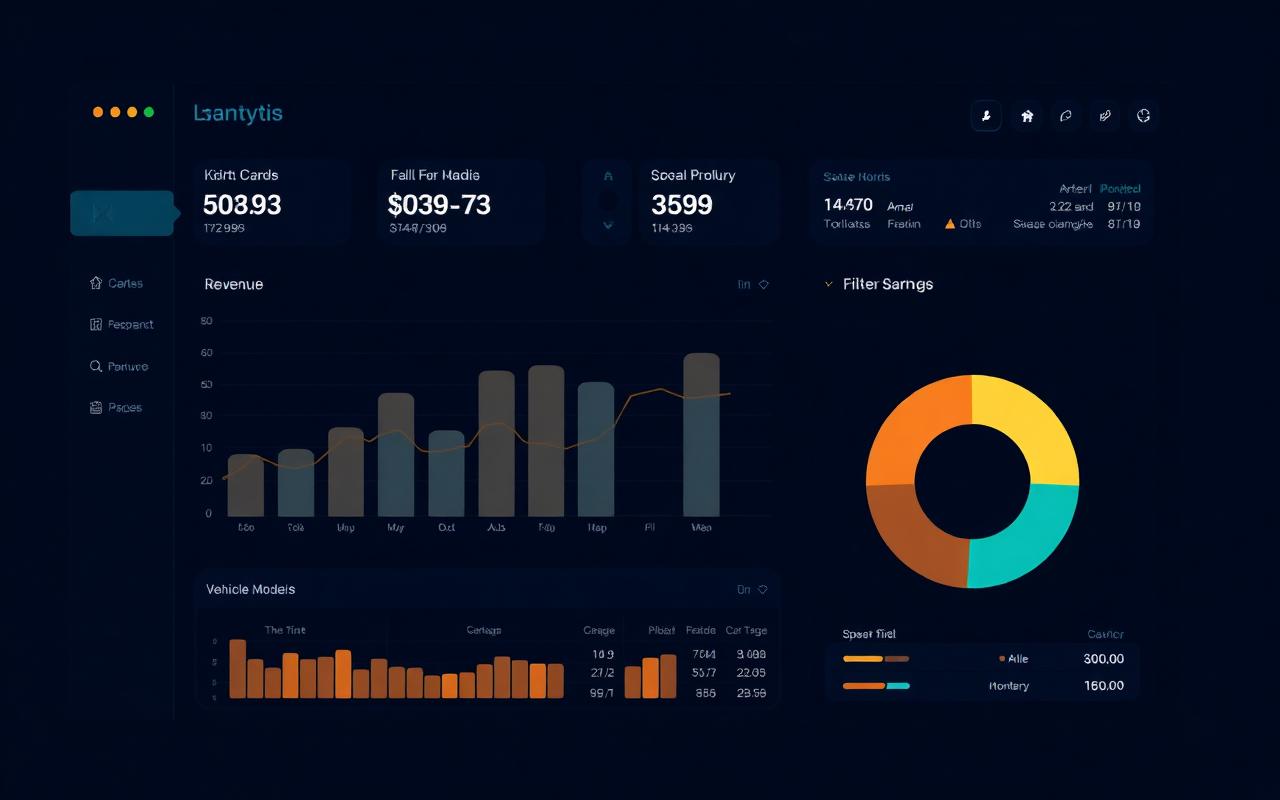
Car Sales Dashboard dashboard preview

Car Sales Dashboard

An interactive sales dashboard designed to analyze vehicle sales performance, revenue trends, customer behavior, and key sales KPIs.

Excel
Power BI
  • Revenue concentration across a small set of vehicle models.
  • Seasonality visible in monthly sales trends.
View Project
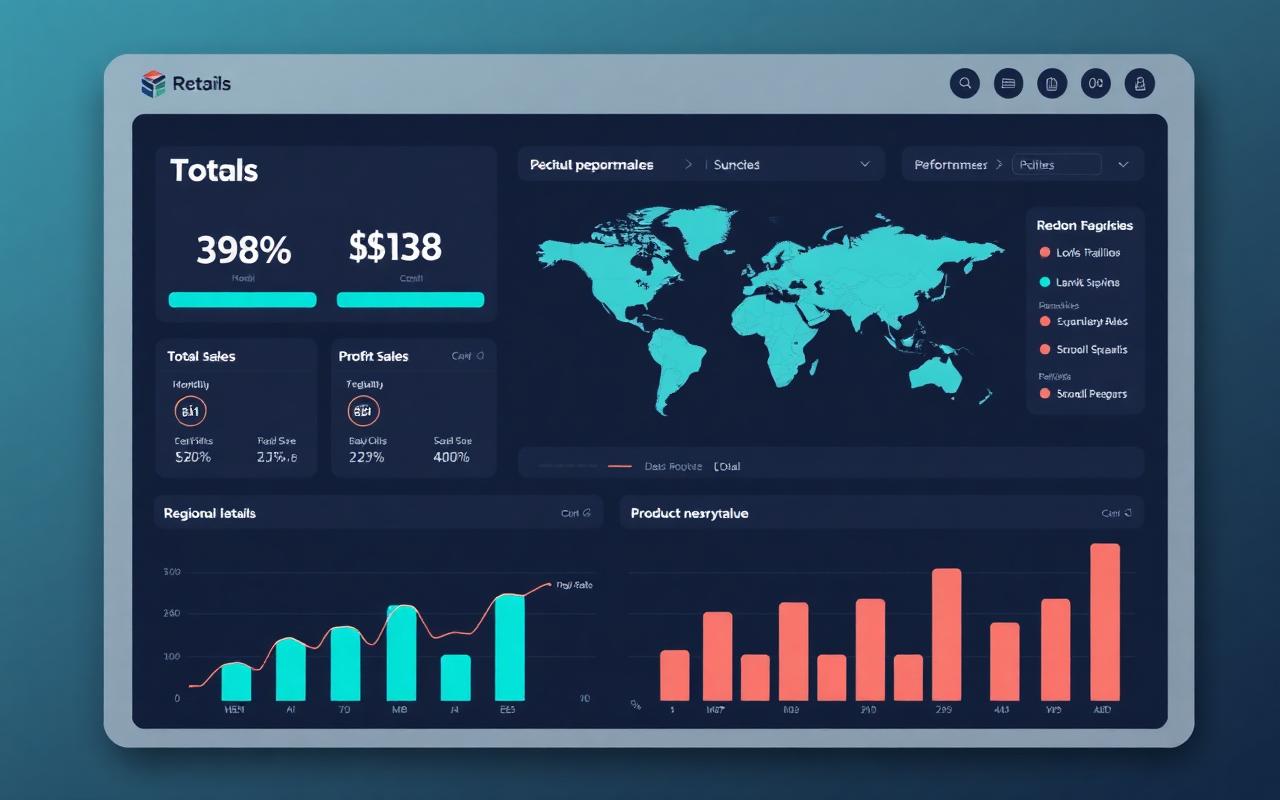
Retail Sales Dashboard dashboard preview

Retail Sales Dashboard

A retail performance dashboard tracking sales, profit and product movement across regions and customer segments.

Excel
Power BI
  • Profit and revenue rankings do not always agree by product.
  • Regional comparison highlights under-performing territories.
View Project
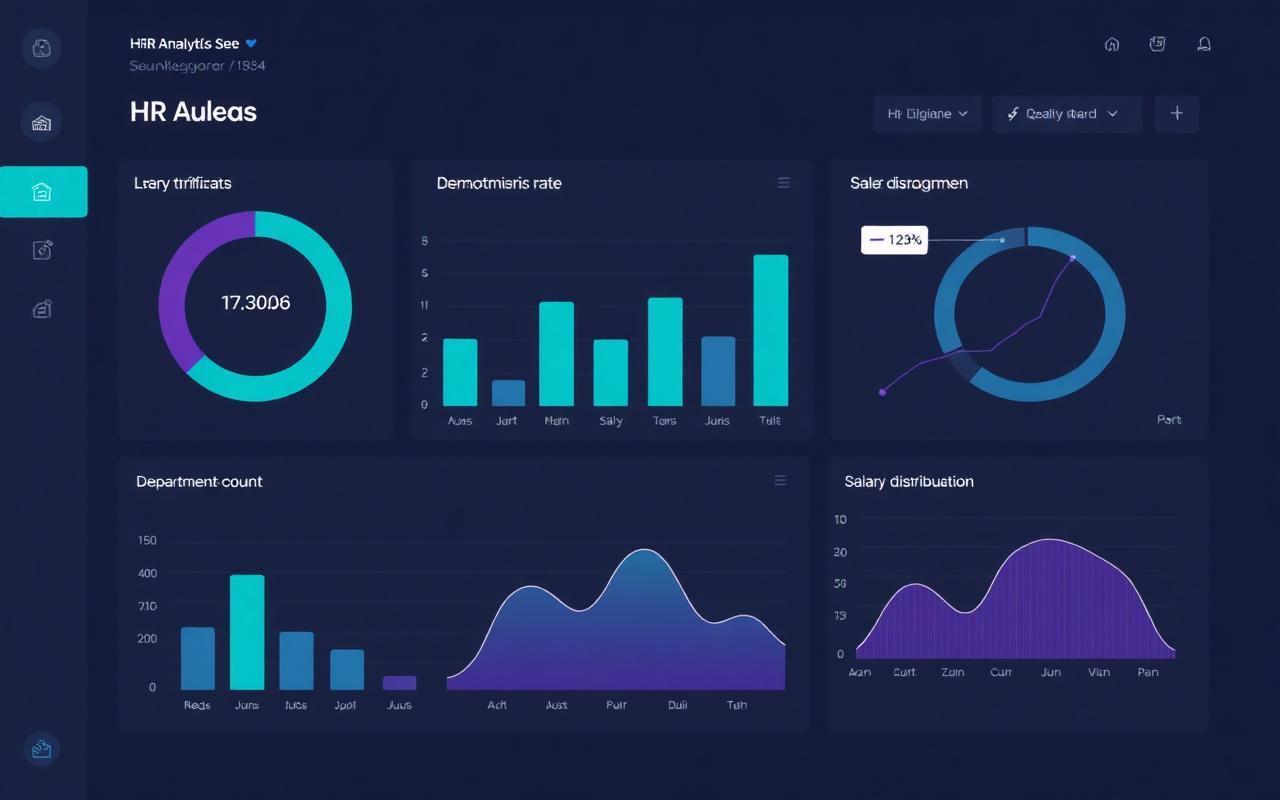
HR Analytics Dashboard dashboard preview

HR Analytics Dashboard

A people analytics dashboard exploring workforce composition, attrition and pay patterns across departments and job roles.

Excel
Power BI
  • Attrition clusters in specific departments and job roles.
  • Salary spread compared across roles and experience bands.
View Project
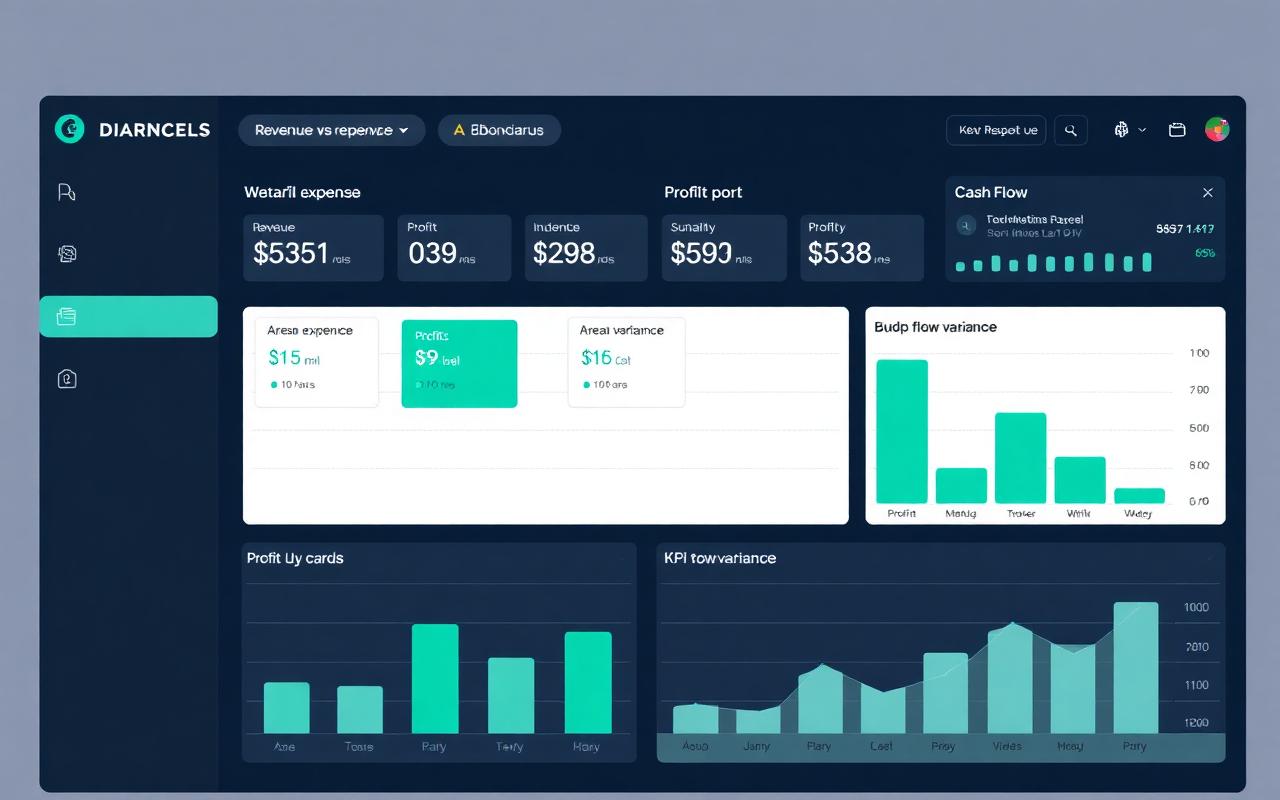
Financial Dashboard dashboard preview

Financial Dashboard

A finance reporting dashboard consolidating revenue, cost and cash movement into a single monitored view.

Excel
Power BI
  • Expense growth tracked against revenue growth month over month.
  • Budget versus actual variance surfaced per cost line.
View Project
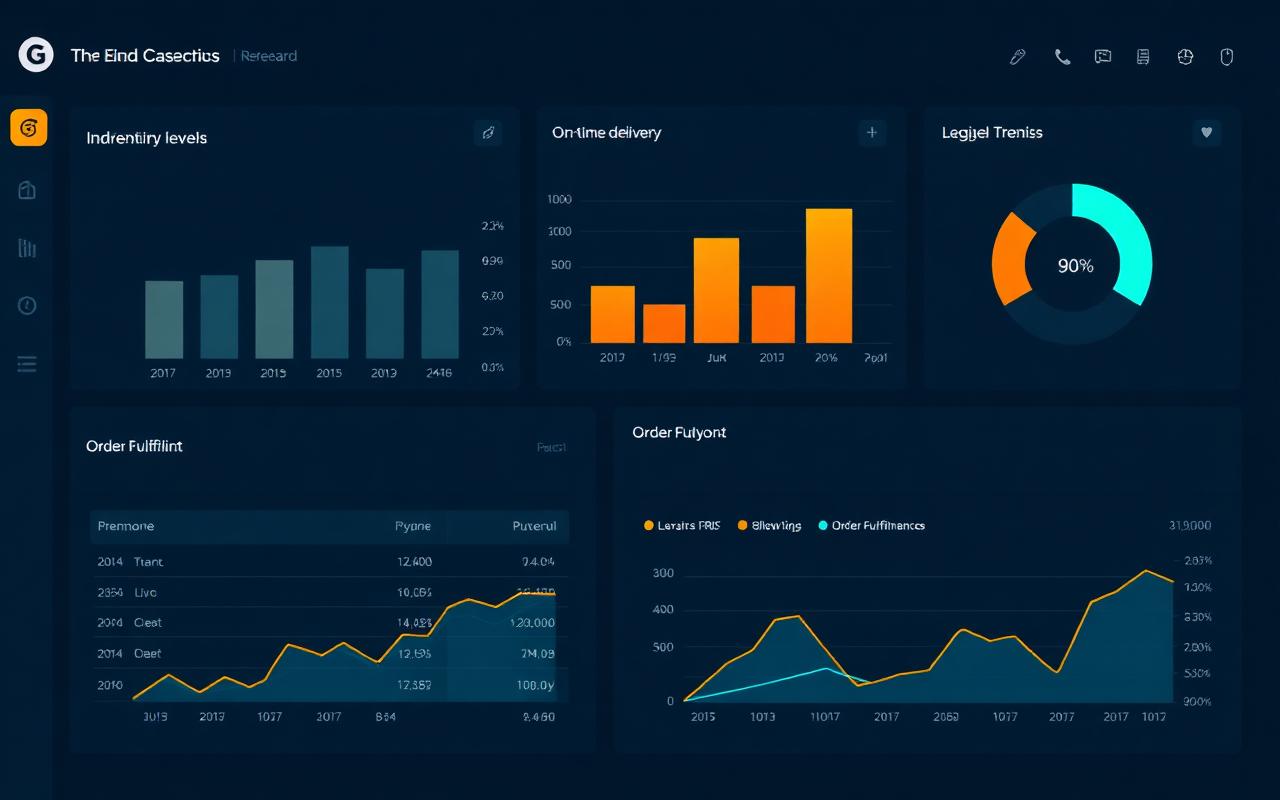
Supply Chain Dashboard dashboard preview

Supply Chain Dashboard

An operations dashboard monitoring inventory, order flow, supplier reliability and delivery performance.

Excel
Power BI
  • Slow-moving inventory identified against order velocity.
  • Supplier scorecards compare lead time and fulfilment reliability.
View Project
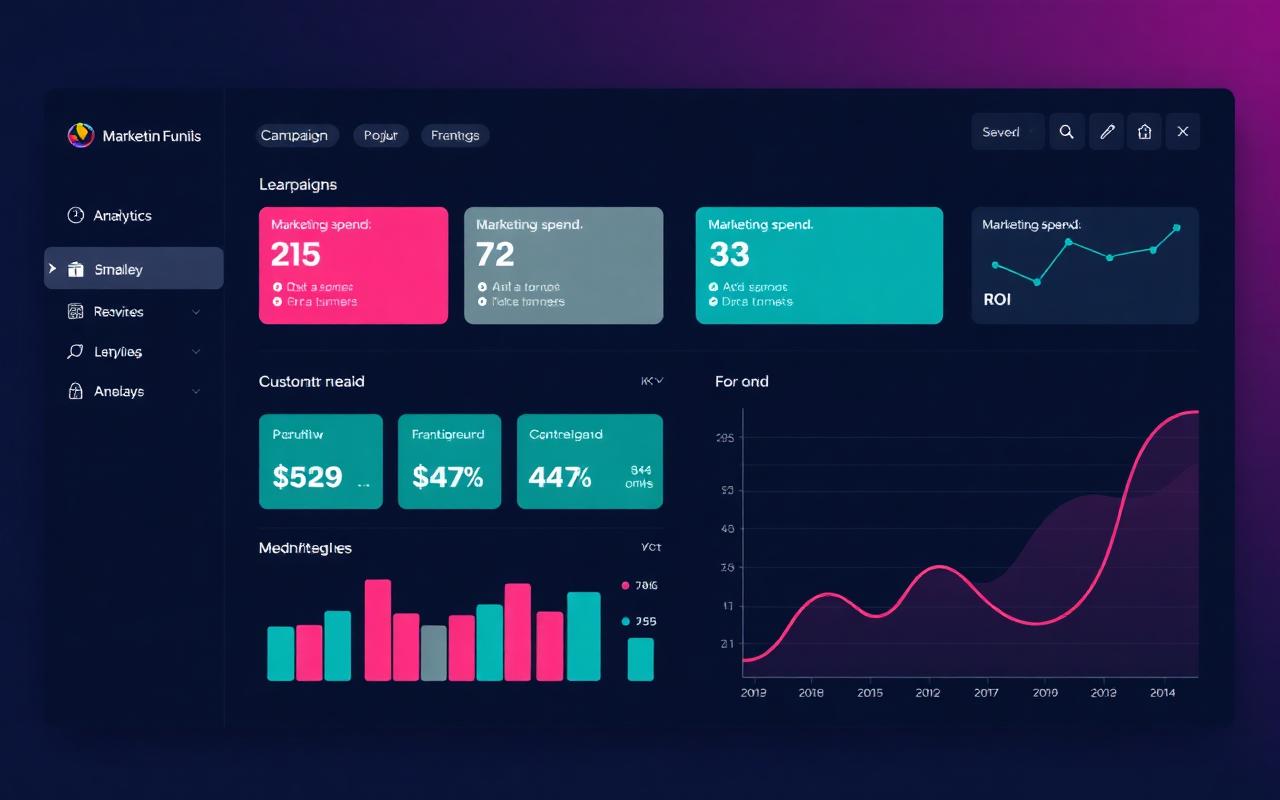
Marketing Analytics Dashboard dashboard preview

Marketing Analytics Dashboard

A campaign analytics dashboard connecting marketing spend to acquisition, conversion and return.

Excel
Power BI
  • Spend efficiency compared campaign by campaign.
  • Conversion drop-off located along the acquisition funnel.
View Project
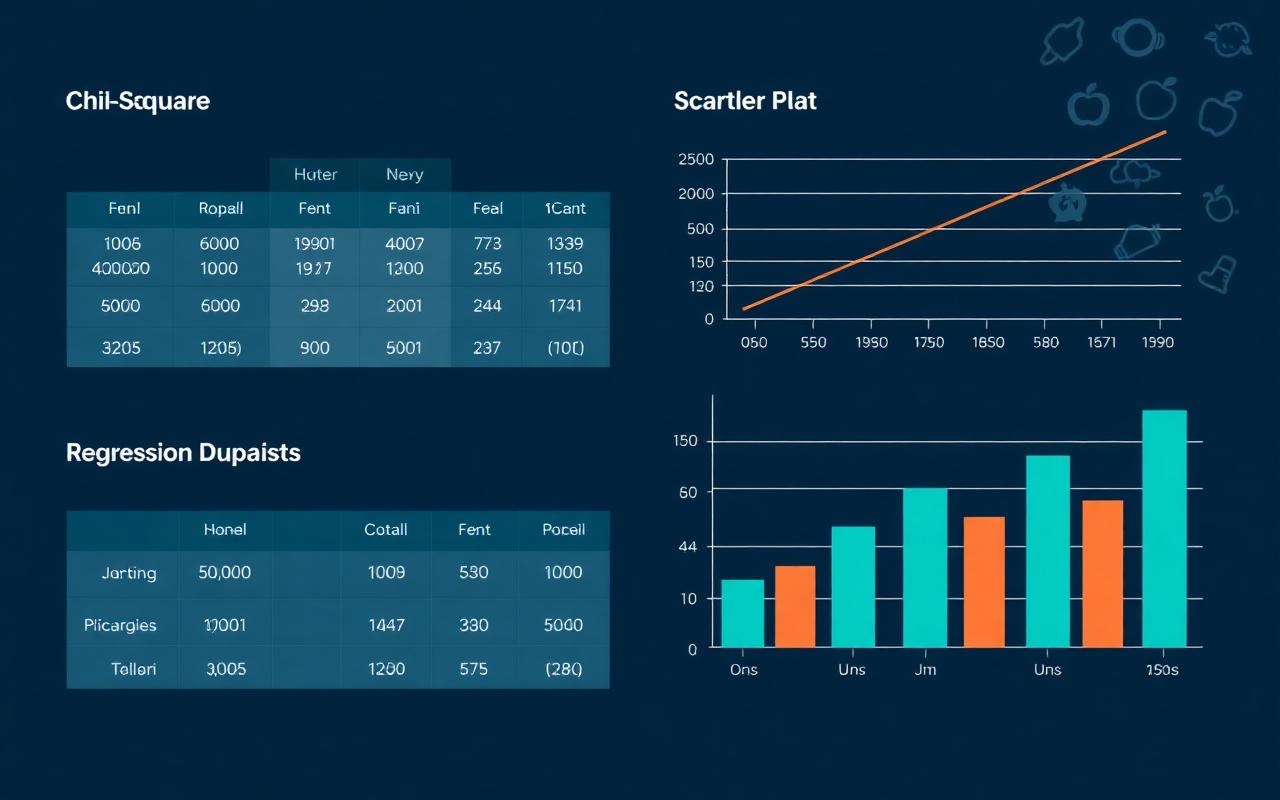
Determinants of Protein Consumption Among FUNAAB Students dashboard preview

Determinants of Protein Consumption Among FUNAAB Students

An undergraduate research project investigating demographic, economic, availability, accessibility, and knowledge-related factors influencing protein consumption among university students.

Excel
SPSS
Statistical Analysis
  • Survey instrument designed, administered and cleaned end to end.
  • Chi-square tests used to examine associations between factors and consumption.
View Project