All projects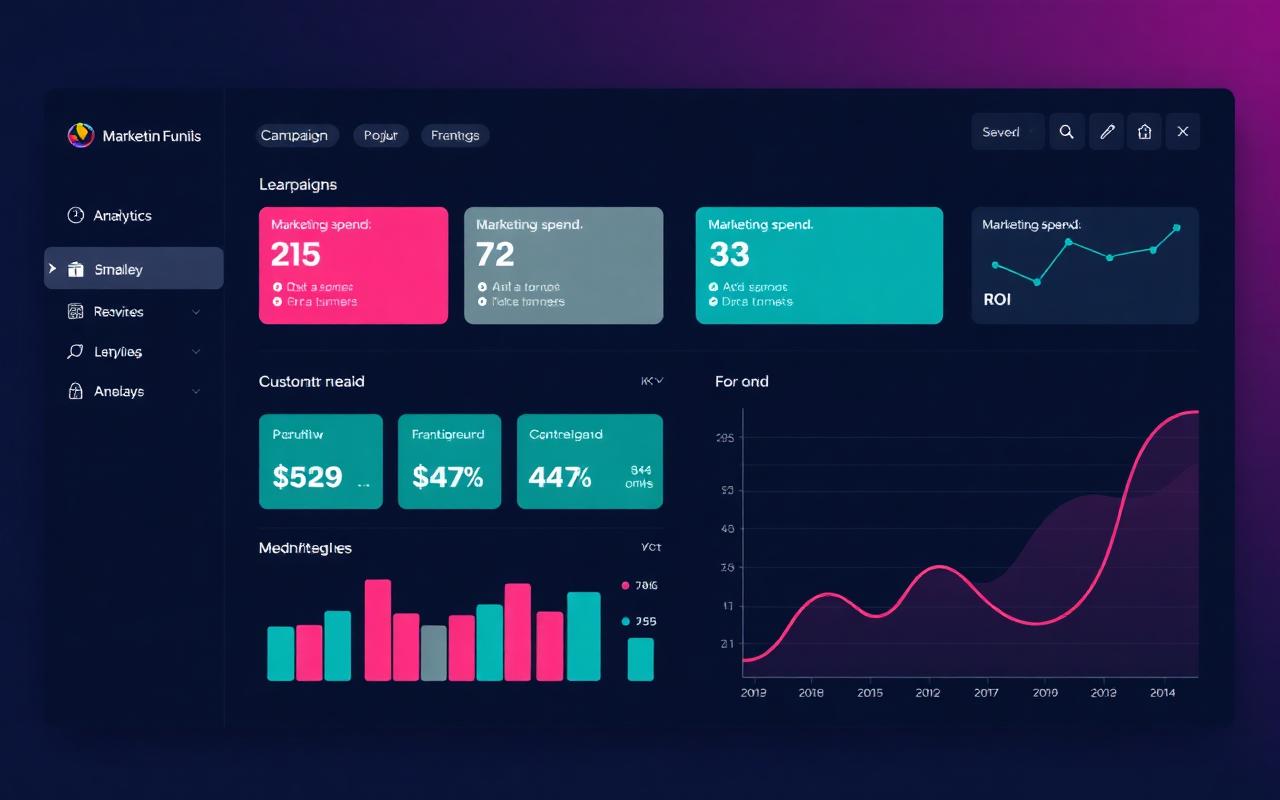
Excel
Power BI
Marketing Analytics Dashboard
A campaign analytics dashboard connecting marketing spend to acquisition, conversion and return.
What the project covers
- Campaign performance
- Customer acquisition
- Conversion rates
- Marketing spend
- ROI
- Customer engagement
Key insights
- Spend efficiency compared campaign by campaign.
- Conversion drop-off located along the acquisition funnel.
- Engagement metrics paired with ROI to avoid vanity reporting.
How it was built
The raw dataset was cleaned and validated first — types corrected, duplicates removed and missing values handled — before any measure was calculated. KPIs were then defined against the questions a decision-maker would ask, and the layout was arranged so the headline numbers read first, with supporting breakdowns and filters underneath.